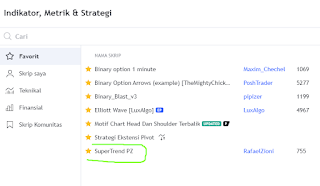
THE INDICATORS IN TRADING VIEWS ARE THE MOST ATTENTIVE AND GOOD TO VIEW WHEN TRADING.
REKOMENDASI SAYA UNTUK PENGGUNAAN INDICTOR SAAT TRADING.
TradingView is a trading and analysis platform that offers a wide range of technical indicators for market traders. Indicators are mathematical tools that use price and/or volume to provide trading signals. They can be used to identify trends, momentum, support and resistance levels, and more.
Some of the more common indicators available on TradingView include moving averages, Bollinger Bands, Relative Strength Index (RSI), Moving Average Convergence Divergence (MACD), volume and momentum. However, there are many other indicators available on the platform as well, both free and paid.
TradingView also offers the ability to create your own custom indicators using the Pine Script programming language. This allows traders to create indicators adapted to their needs and share them with the TradingView community.
To use indicators on TradingView, you need to select a chart and click on the indicator icon in the upper right corner. From here, you can search for the desired indicator and apply it to your chart. The indicators can be customized according to your preferences, for example by changing the parameters of the indicator or changing the time frame of the chart.
PIC.. RESULT .
SUPER TREND PZ.
- Media mobile (Moving Average): una linea che segue il prezzo medio di un asset nel tempo, spesso utilizzata per identificare le tendenze del mercato.
- Oscillatore stocastico (Stochastic Oscillator): un indicatore di momentum che misura la posizione del prezzo di un asset rispetto ai suoi massimi e minimi recenti.
- RSI (Relative Strength Index): un altro indicatore di momentum che valuta la forza di un'asset in base alla sua performance recente.
- Bollinger Bands: un indicatore di volatilità che traccia due bande intorno al prezzo medio di un asset, basate sulla deviazione standard dei prezzi.
- MACD (Moving Average Convergence Divergence): un indicatore di momentum che utilizza due medie mobili per identificare i punti di inversione delle tendenze.
- Oltre a questi indicatori, TradingView offre anche una vasta gamma di altri strumenti di analisi tecnica, tra cui indicatori personalizzati, disegno di linee di tendenza, supporti e resistenze, modelli di grafici e molto altro ancora.


No comments:
Post a Comment